NASA Space Apps Cairo 2026 · Harmonization of MODIS and VIIRS hot spots

Is this fire season normal?

Twenty-five years of satellite fire detections from MODIS and VIIRS, merged into one consistent record. Pick any area on Earth and see when it burns, which years were worst, and whether this month is out of the ordinary.

MODIS · 2000 → nowVIIRS · 2012 → nowOne harmonized record

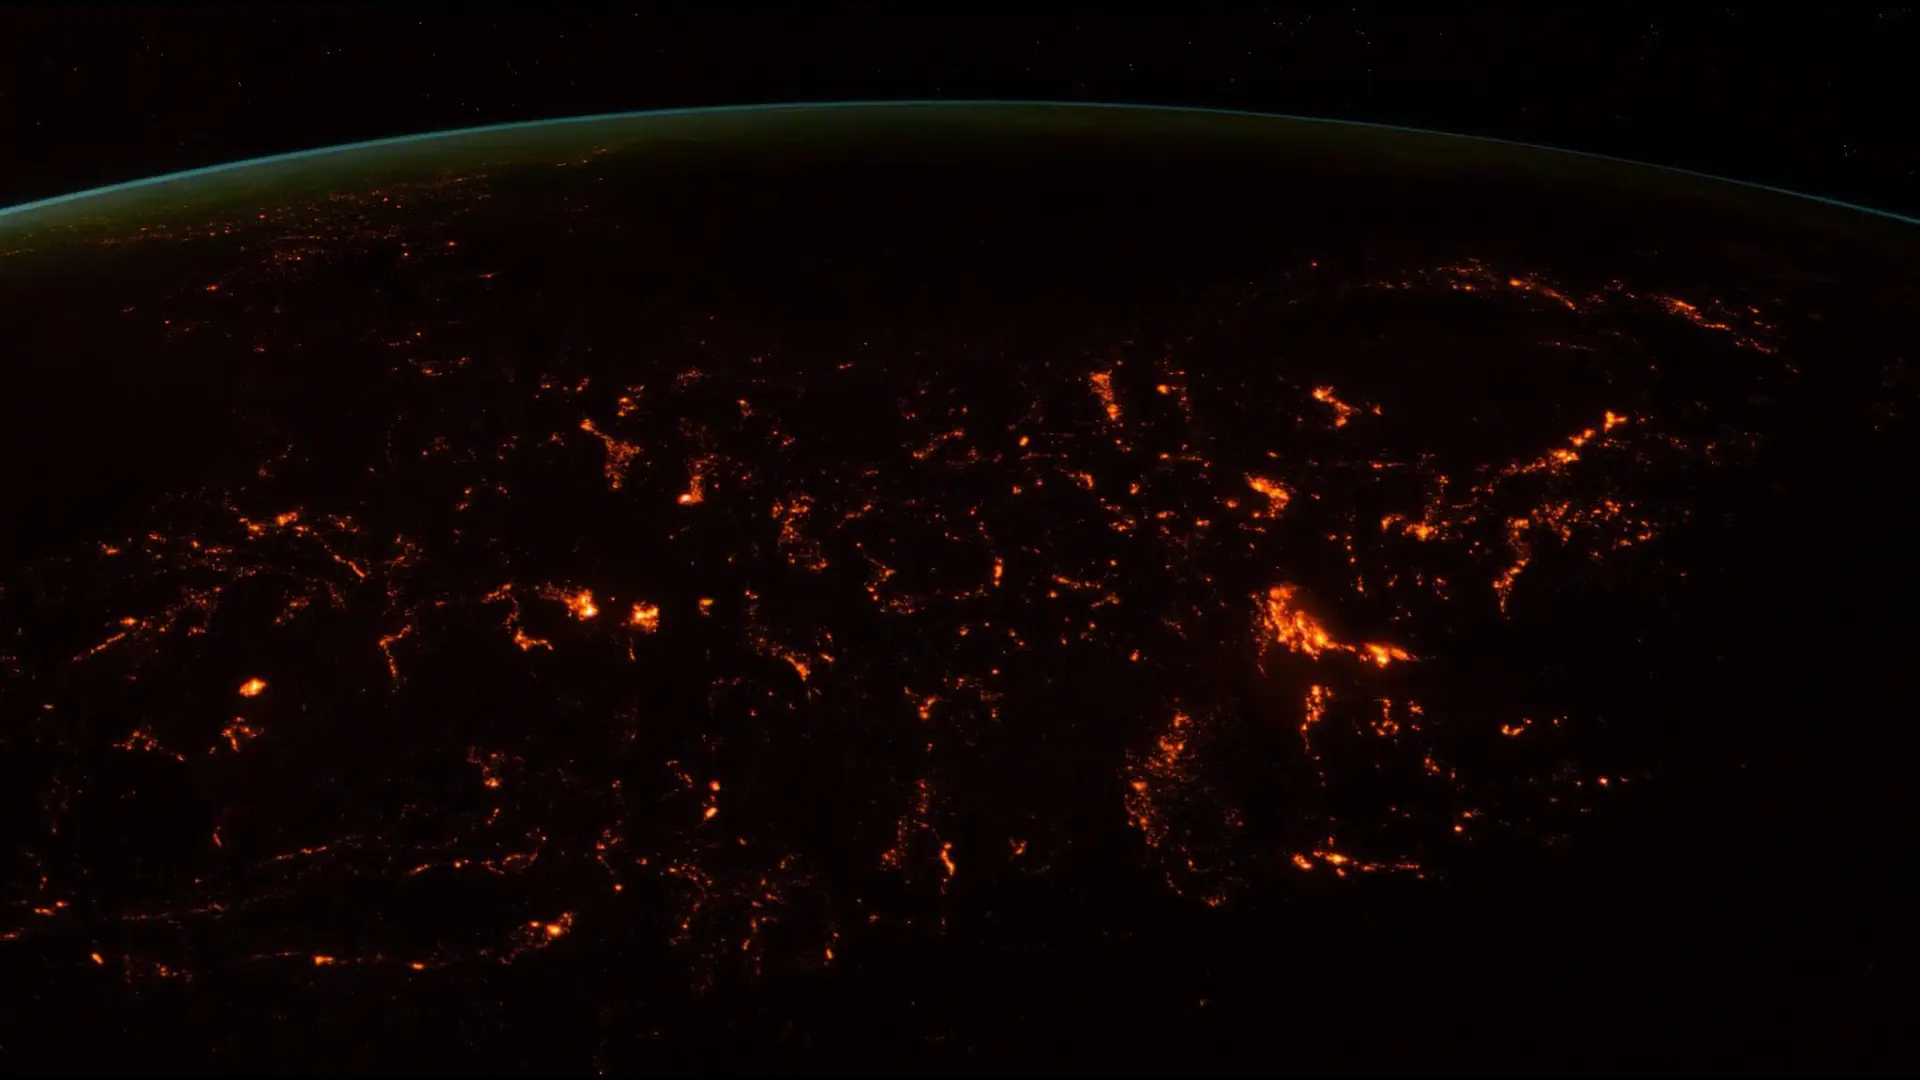
Every glow is a real detection: NASA FIRMS, 27 Oct to 3 Nov 2026. Drag the globe.
One week, the whole planet

300,095 fires seen from orbit in seven days.

Each glow is a 0.1° cell, the grid our record lives on, where VIIRS detected burning: savanna fires across Africa, farm burning in Asia and South America, forest clearing. Real data, 27 Oct to 3 Nov 2026.

Since 2000 · MODIS on Terra and Aqua

The first eye: 1 km pixels.

MODIS flags a pixel when a fire heats enough of a square kilometre. Small fires slip through.

This week
58,127
detections, Terra and Aqua together
Aqua
705 km
up, a 2,330 km wide swath
Since 2012 · VIIRS on Suomi NPP, NOAA-20, NOAA-21

The sharper eye: 375 m pixels.

VIIRS sees fires MODIS never could. Same planet, same week, far more detections.

This week
300,095
detections from NOAA-20 alone
vs MODIS
5.16×
more, for the same fires
The problem we solve

Glue them together and fire seems to explode in 2012.

The world didn't start burning more when VIIRS launched. We calibrate MODIS against VIIRS over the years both flew, so 2005 and 2025 speak the same units.

Raw join
2.9×
more hotspots after 2012
Our record
1.02×
no break (mock data until Nov 13)
Raw MODIS + VIIRS Harmonized 2001–2025
Closer to home

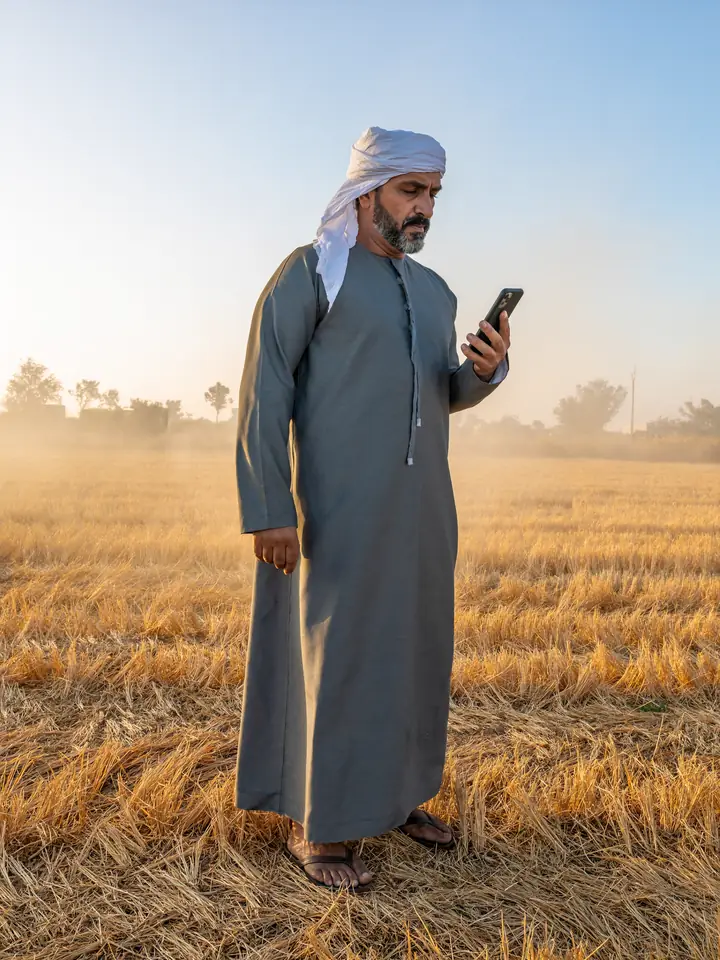
The Nile Delta, rice-straw season.

After the harvest, farmers burn the straw. Small, short fires: this week VIIRS found 88 in the Delta, MODIS 7. A record that mixes the two can't tell you if this season is heavy.

Generated scene · Higgsfield

From 700 km up to the field.

How it works

Three steps from map to answer.

01

Draw your area

Sketch a polygon, drag a box, pick a province, search a place, or type a latitude and longitude.

02

Read the calendar

Every month since 2001 in one grid. Bright cells are heavy burning; the pattern is your fire season at a glance. Above: the Nile Delta.

03

Compare and export

See how a month ranks against history (percentile, z-score), then download CSV, GeoJSON or GeoTIFF for your GIS.

The proof

Two satellites. One record. No fake spikes.

We calibrate MODIS against VIIRS over the years both flew, then check the seam at 2012 is gone. Raw join: 2.9× more hotspots after 2012. Our record: 1.03×.

Raw MODIS then VIIRS, glued togetherHarmonized (our record)Mock data until Nov 13
2012: VIIRS arrives. Raw counts leap; same fires, sharper eyes.
Two places, one question

Routine, or unprecedented?

Generated scene
Case study · CONAE's example

Río Negro, July 2026

Winter fires in northern Patagonia made the news. The calendar puts that month against every July since 2001, on one record that doesn't change meaning when the satellites do.

Open Río Negro, July 2026
Generated scene
Closer to home

The Nile Delta's rice-straw season

Every October and November, farmers burn rice straw across the Delta. This week VIIRS found 88 hotspots there and MODIS 7. Is this year's season heavier than usual?

Open the Nile Delta, October 2026
Who it's for

Built for the people who watch the fires.

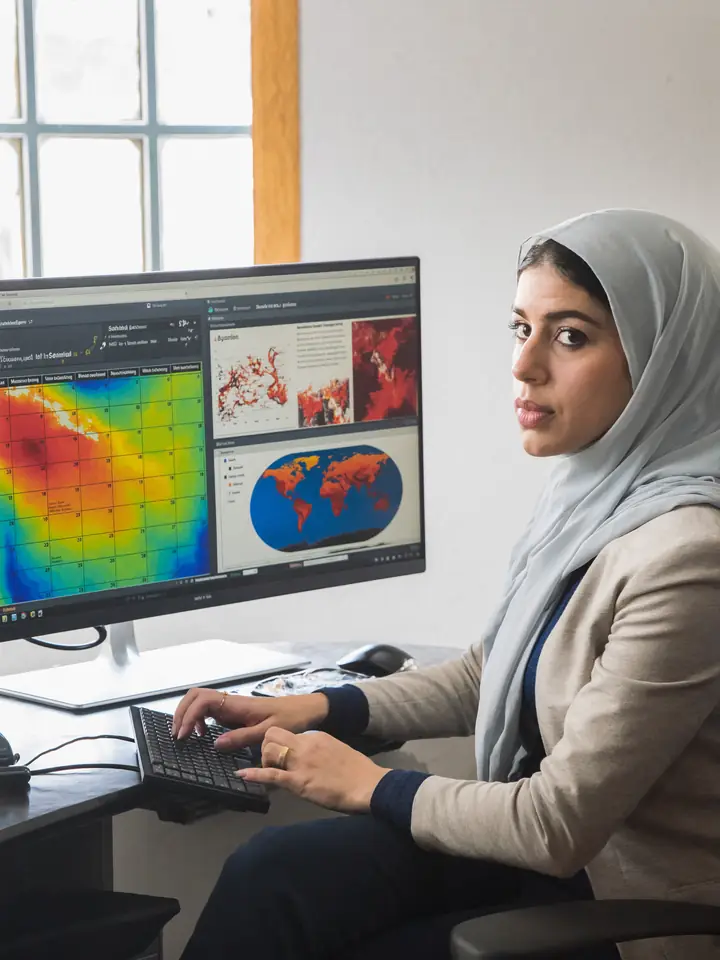
Generated portrait

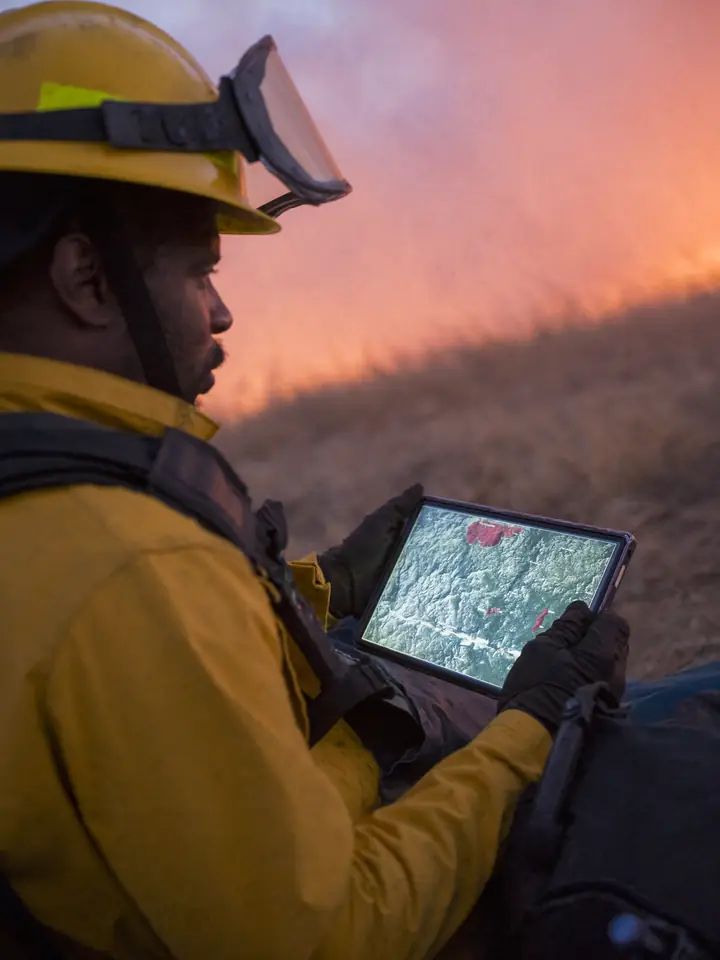
Emergency responders

Is today’s activity routine for this season, or a surge?

Generated portrait

Scientists

One sensor-agnostic series from 2001 to now, ready for trend work, with its validation published.

Generated portrait

Land managers and farmers

Know the critical months before they arrive, and how this season compares.

Questions

Before you trust a number.

Is a hotspot a fire?

Not always. A hotspot is a pixel that looked hot from orbit. One fire can make many hotspots, and a gas flare can make one too. We drop known industrial and volcanic sources.

Why not just add MODIS and VIIRS together?

VIIRS sees smaller and cooler fires, so it reports several times more hotspots for the same fires. Glued together, the record jumps in 2012 even though the fires didn't change. We convert MODIS to VIIRS-equivalent values first.

How current is it?

The record runs to last month from NASA's standard archive, with near-real-time data for the newest weeks. The current month is compared with the same days in past years.

Can I download the data?

Yes. Any area as CSV or GeoJSON (individual hotspots), the monthly calendar as CSV, and the 0.1° grid as a Cloud-Optimized GeoTIFF.

Does no hotspot mean no fire?

No. Clouds, thick smoke, small fires and burning between satellite passes can all hide a fire. Read zero as nothing detected.

What is real and what is generated?

Every number, the globe's fires and the maps are NASA data. The films of the Delta and Patagonia, and the portraits, are generated scenes (Higgsfield) and are marked as such.

Pick a place. See its fire history.

Any polygon on Earth, every month since 2001, on one consistent record.

Generated scene